
Market Analysis for:
Brian Gonzalez &
Elie Mehanna
I've done a market analysis on your home at 8 Humboldt Ave Unit 2 in Roxbury and have prepared this webpage to help explain how your home’s price was derived. The analysis considers your home’s size, configuration, number of bedrooms and baths, lot size and general condition.
The analysis also scrutinizes for issues that could impact the price of a home making it more or less valuable.
Finally the analysis looks at your current competition - the other homes that buyers in your price range will be viewing, to help determine your price.
Contents
Market Dynamics
Market Analysis
Pricing Strategy
1. Market Dynamics
There are always a number of buyers looking to buy in Roxbury because of the access to great Boston schools like Boston Latin School (the #1 public high school in the state), larger homes, proximity to Downtown, and the community dynamics. People like the feeling of the the community centers, and want to stop and have a coffee, or have dinner at the many family owned restaurants, or just watch the world go by, chatting with folks who are out and about. The parks as well as the Blue Hills Reservation close by pull those who desire an outdoor lifestyle while still remaining within commuting distance to downtown.
Average Sale Price
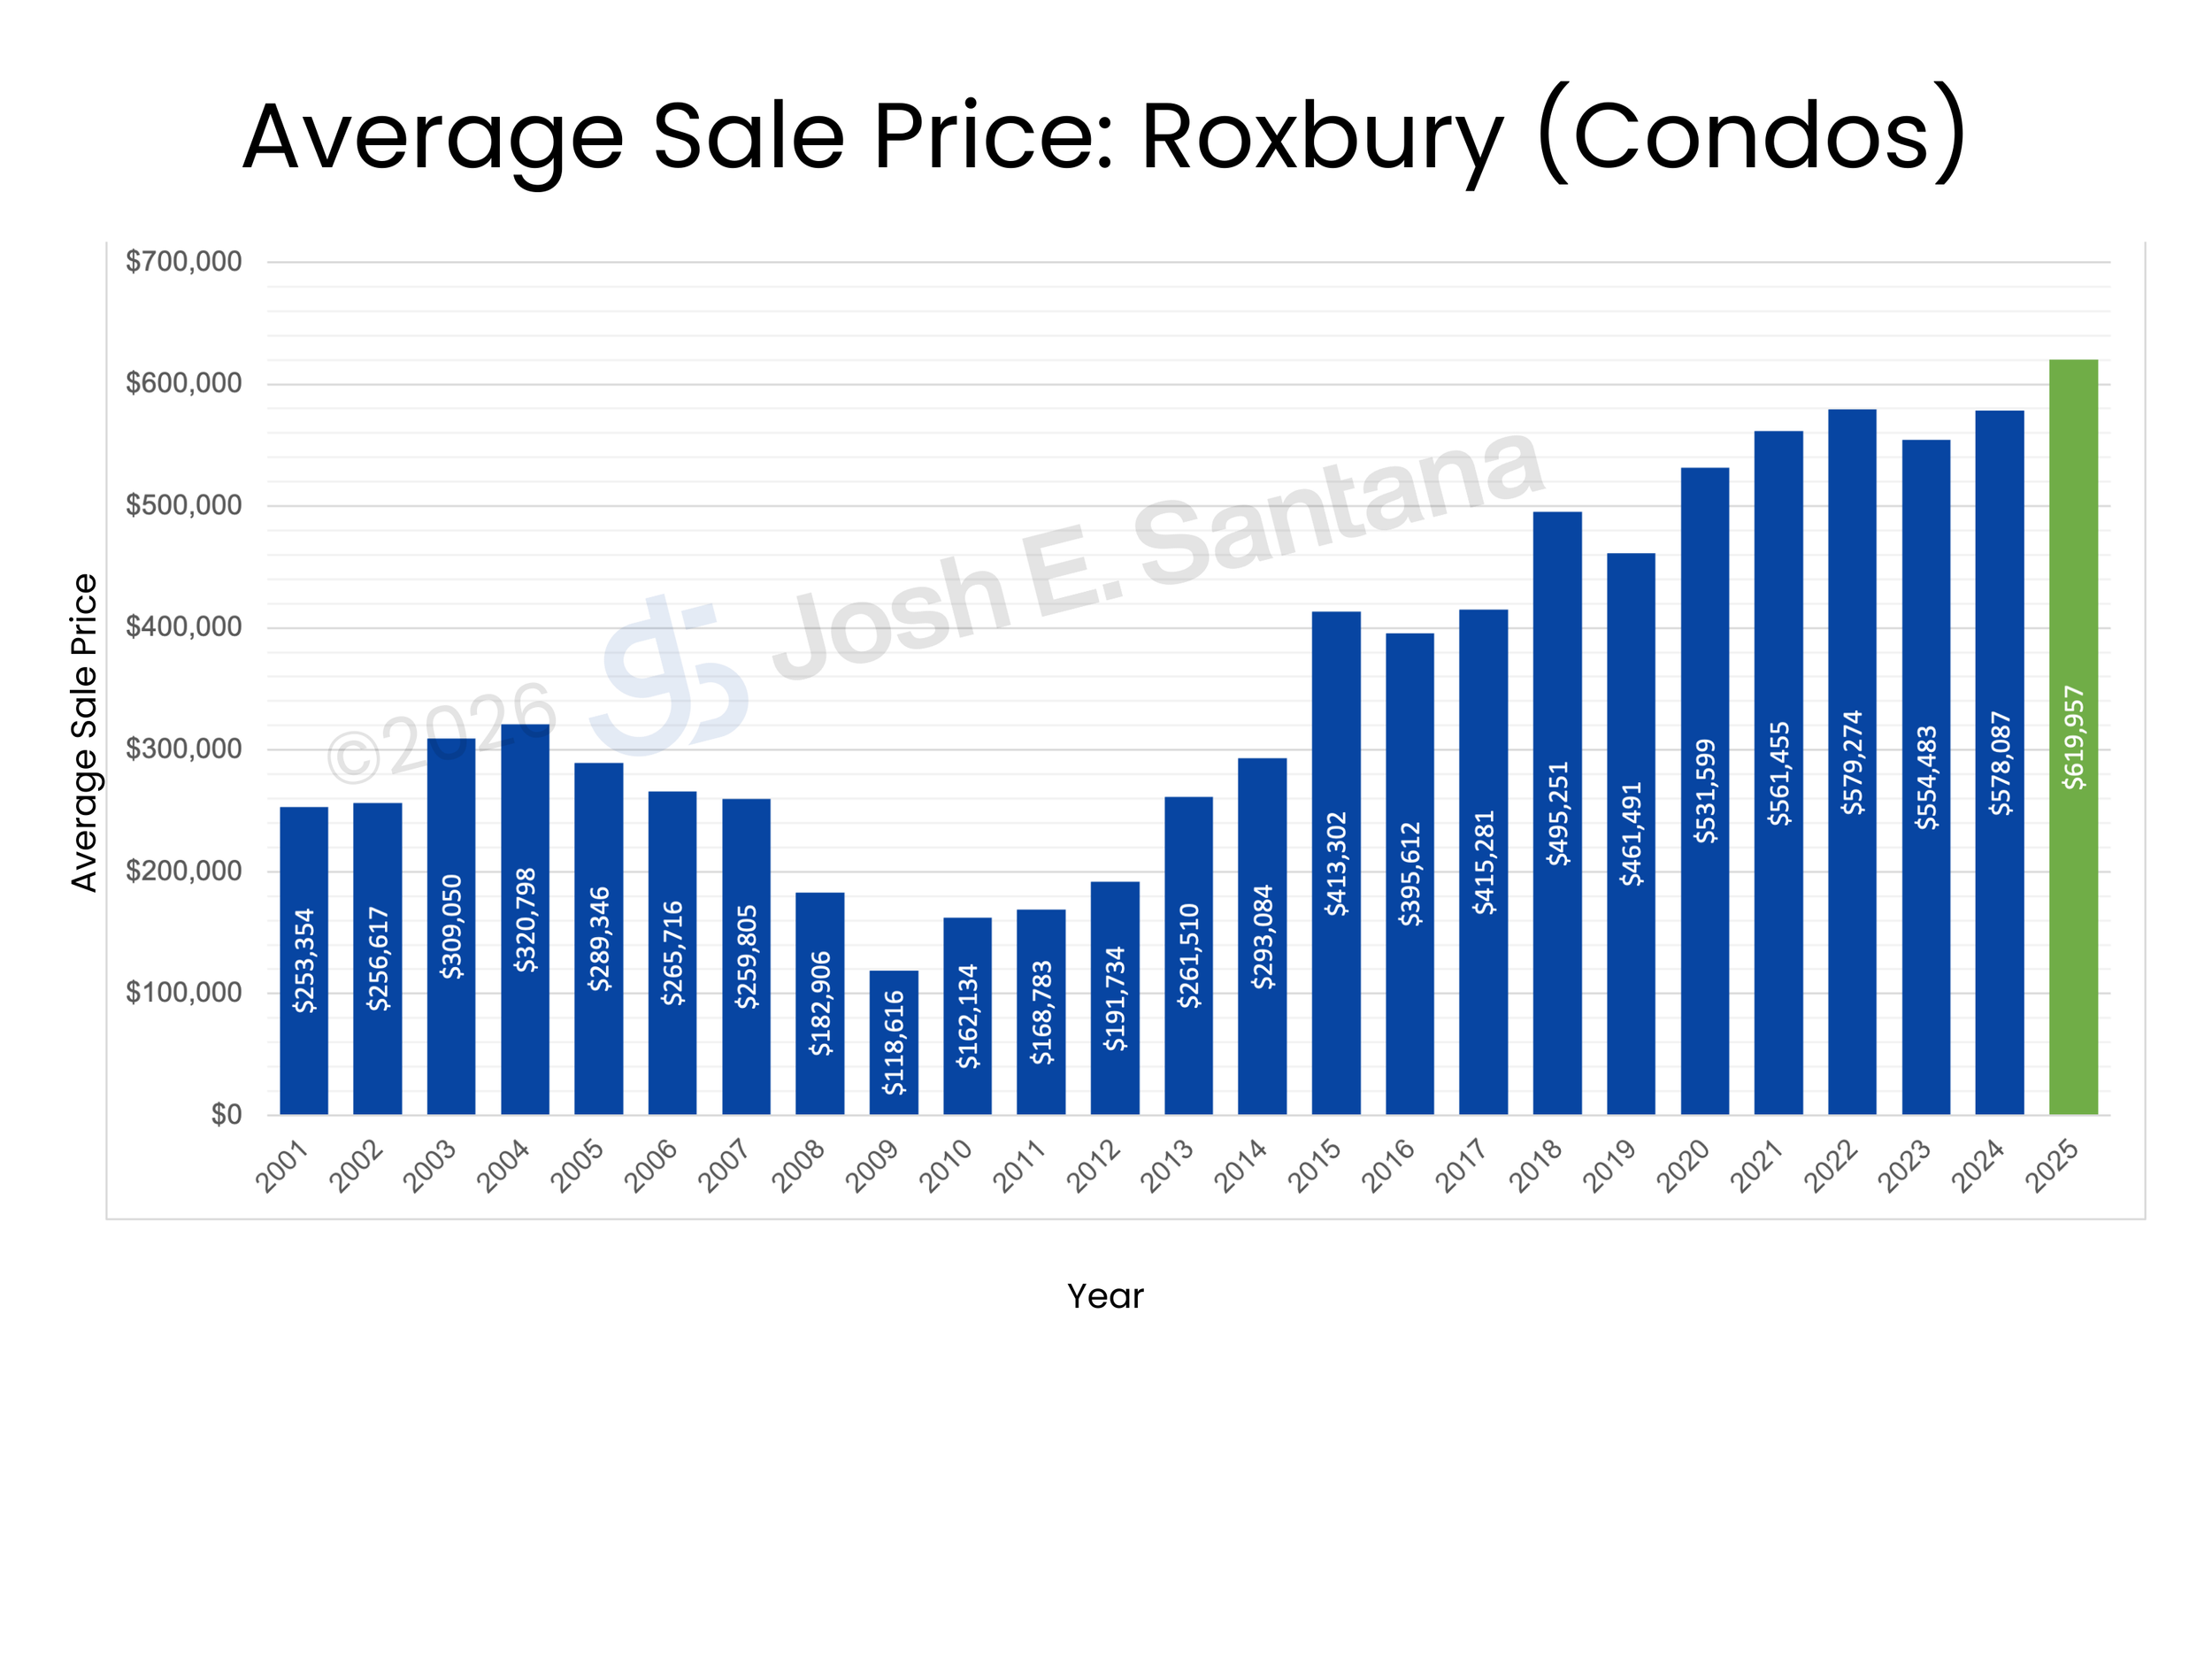
Average prices in Roxbury are well above average prices obtained in the peak of the market in 2004. Average condo prices have been on an upward trend since 2010. Roxbury saw price dips in 2016, 2019, and 2023. During 2020, there was a large increase despite concerns over a potential economic downturn in the future and migration away from the city. COVID-19 and the resultant skyrocketing buyer demand have meant that average prices increased steeply since 2020. We saw a decrease in 2023 and prices have been increasing steadily since then.
Sale Price Distribution
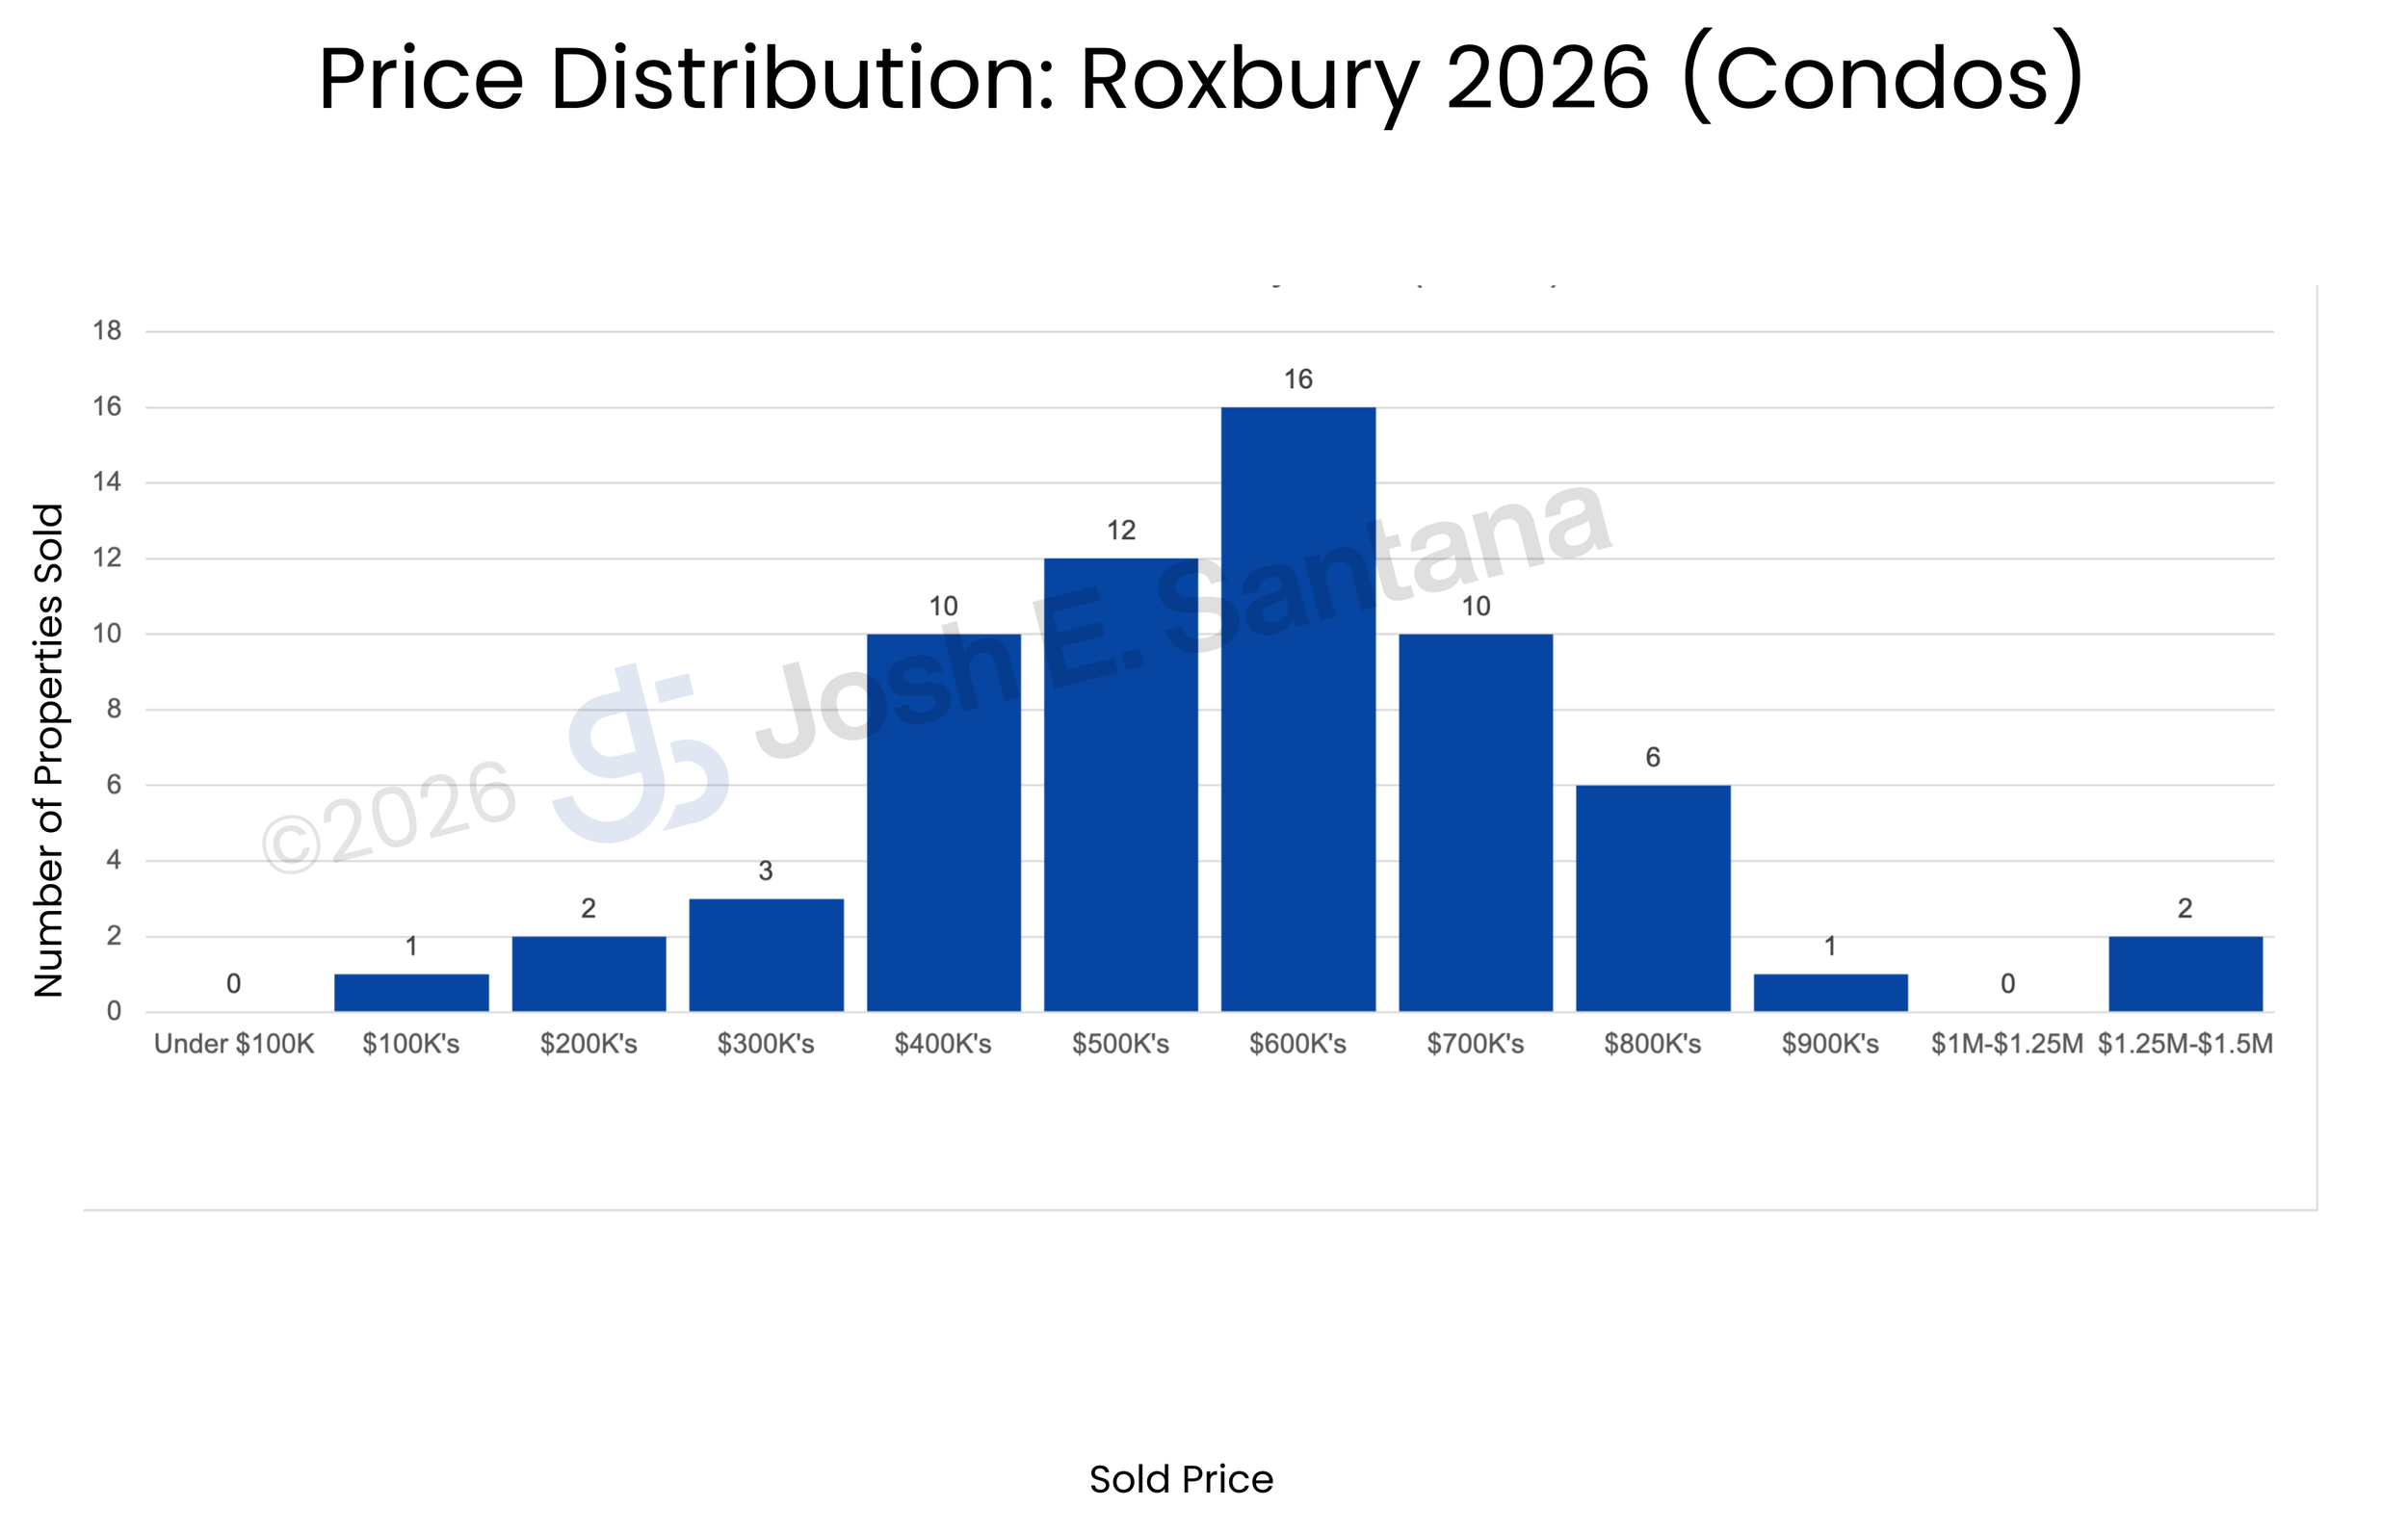
Sales distribution statistics show that the $500K and $600K price ranges are the most active for condos in Roxbury.
Price per SqFt
Before reviewing the price per square foot charts it is important to throw in a caveat of using the average as the definitive guide. There is wide variability among agents as to what is included in the living area reported in MLS. In some instances, agents will include a finished component of the basement in the living area and this is acceptable so long as how the living area is calculated is disclosed. Others report the living area cited in the assessor’s database, which never includes finished areas in the basement, (but they note in MLS that there is a finished basement).
To this end, it is important to review each individual listing to determine the ‘true’ price per SqFt for above ground living area. However, when I home has a finished basement, we do need to factor that in as well.
➡️…By Price
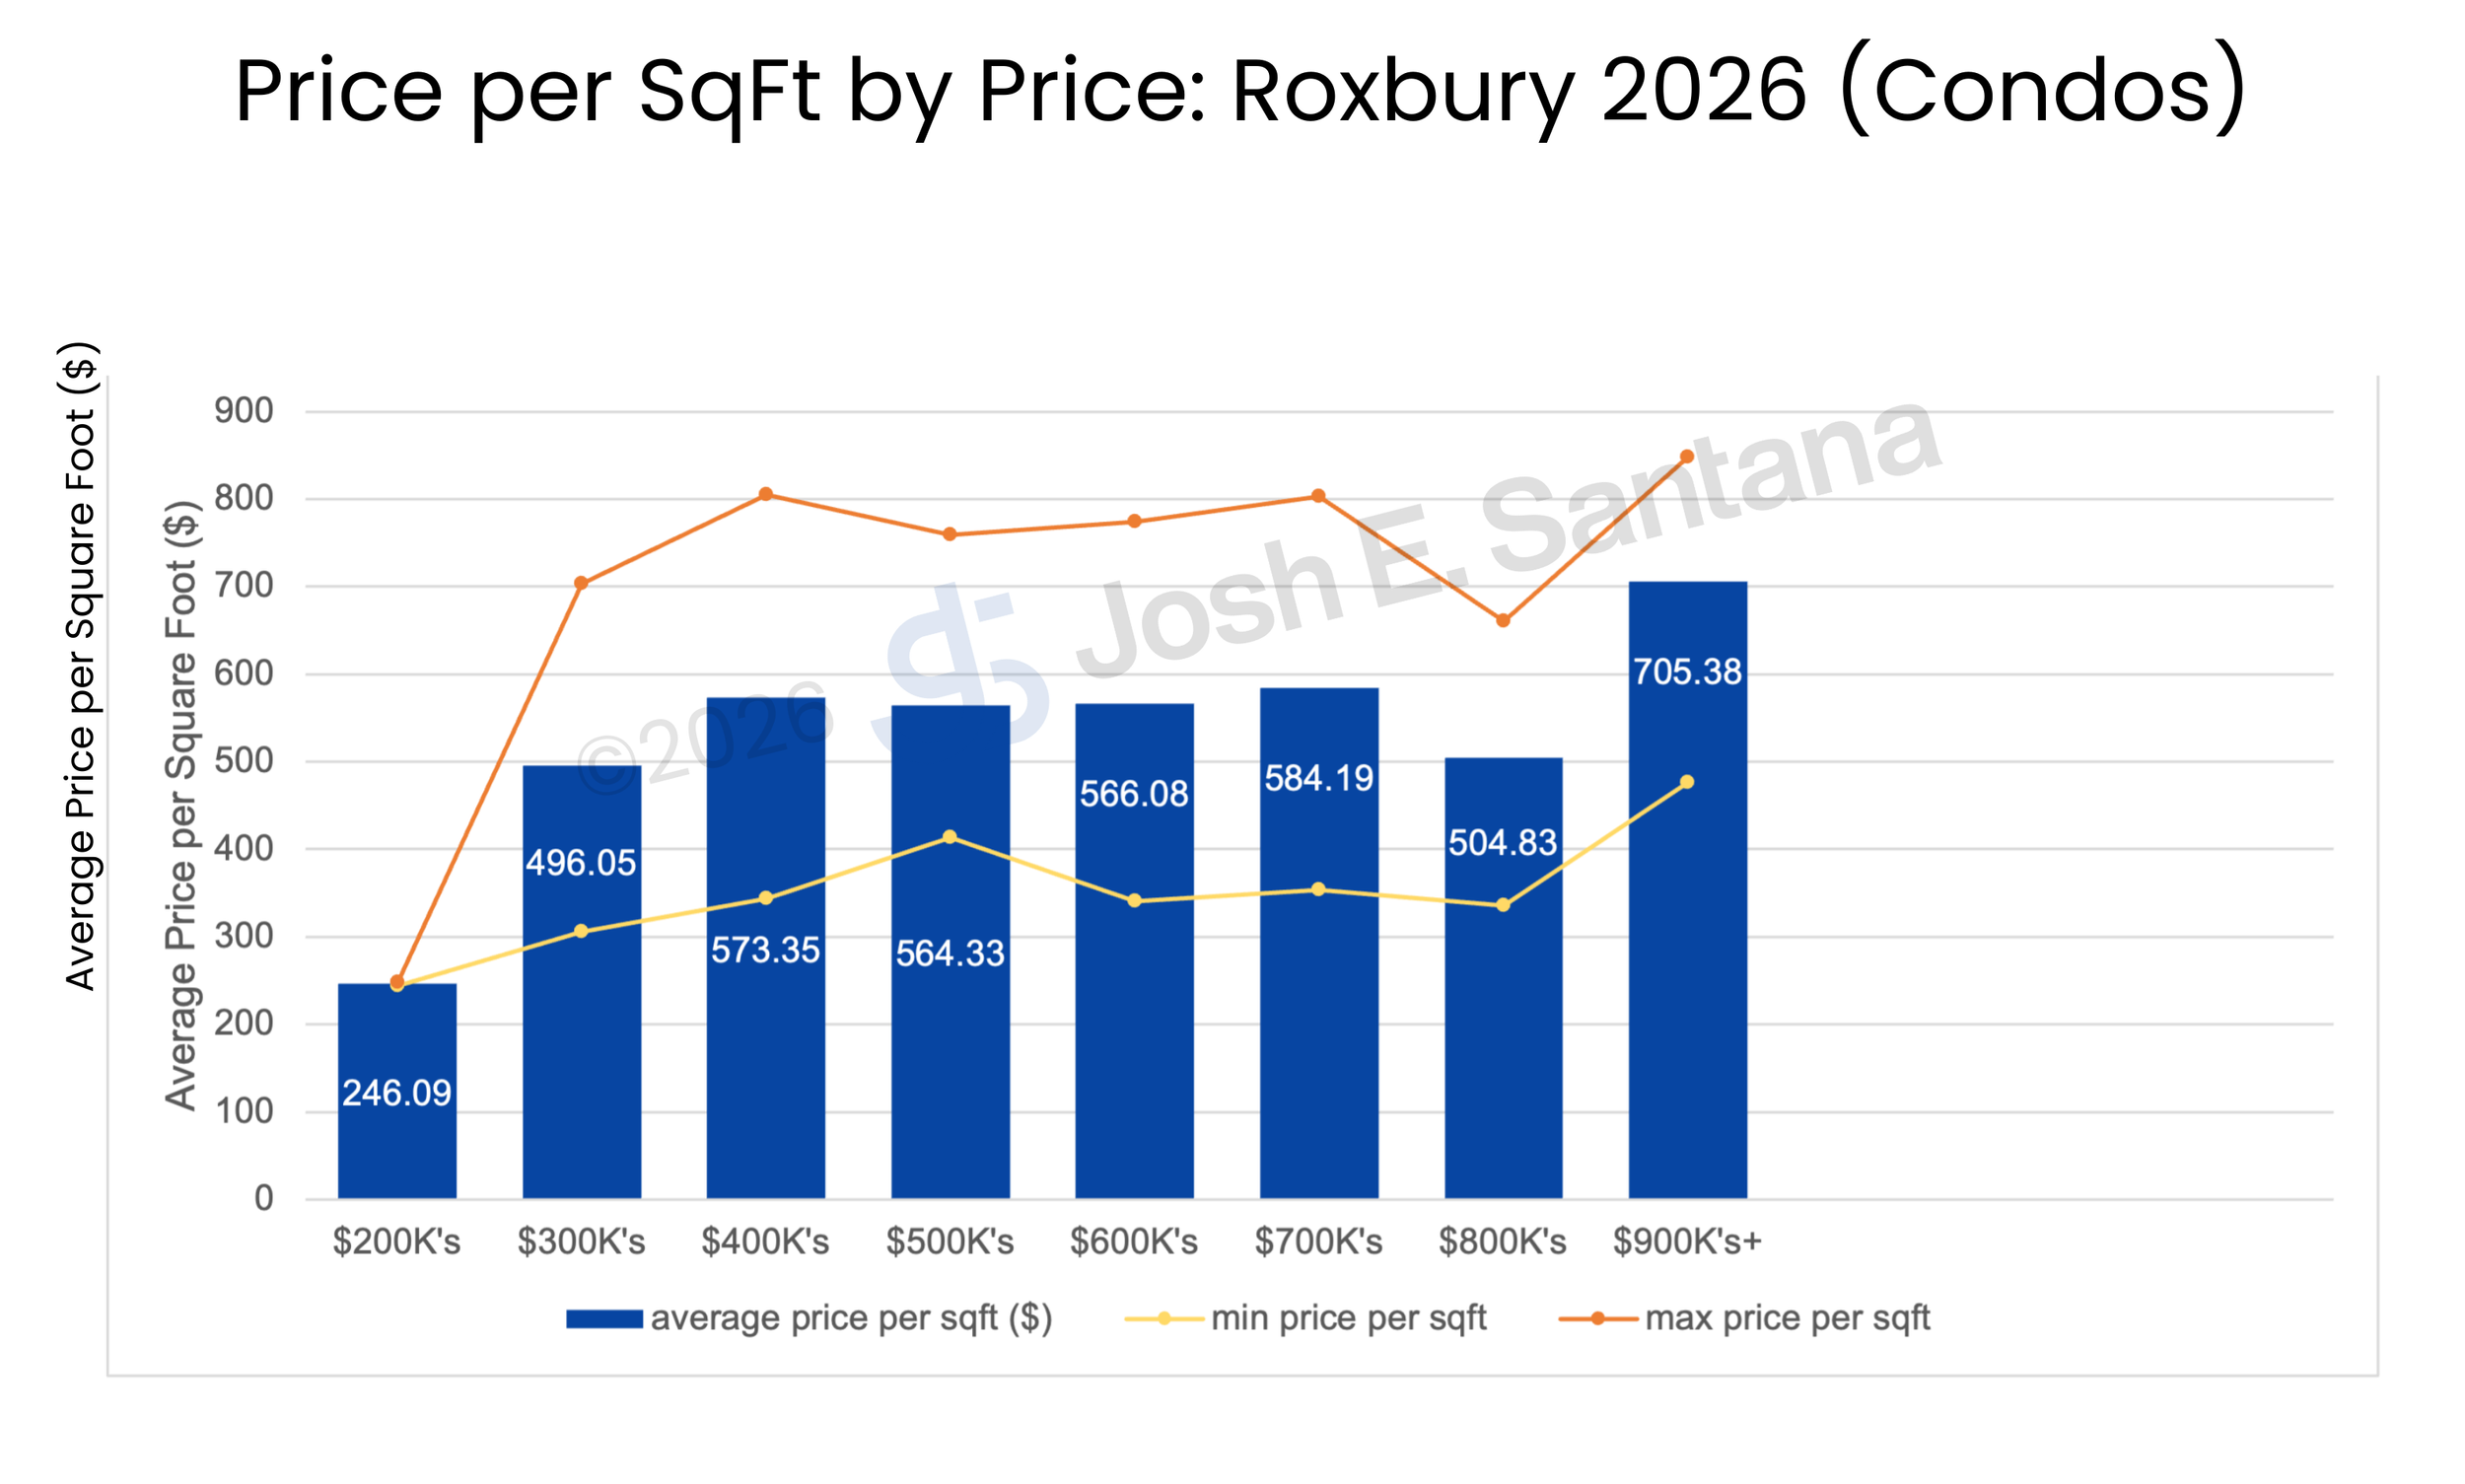
Reviewing the price per SqFt charts shows us the average price per SqFt in Roxbury along with the maximum price per SqFt and the minimum obtained for each price range. In Roxbury, the average price per square foot remains similar through all prices ranges around $500/SqFt with homes in the $900Ks selling for the highest price per square foot.
➡️…By Year Built
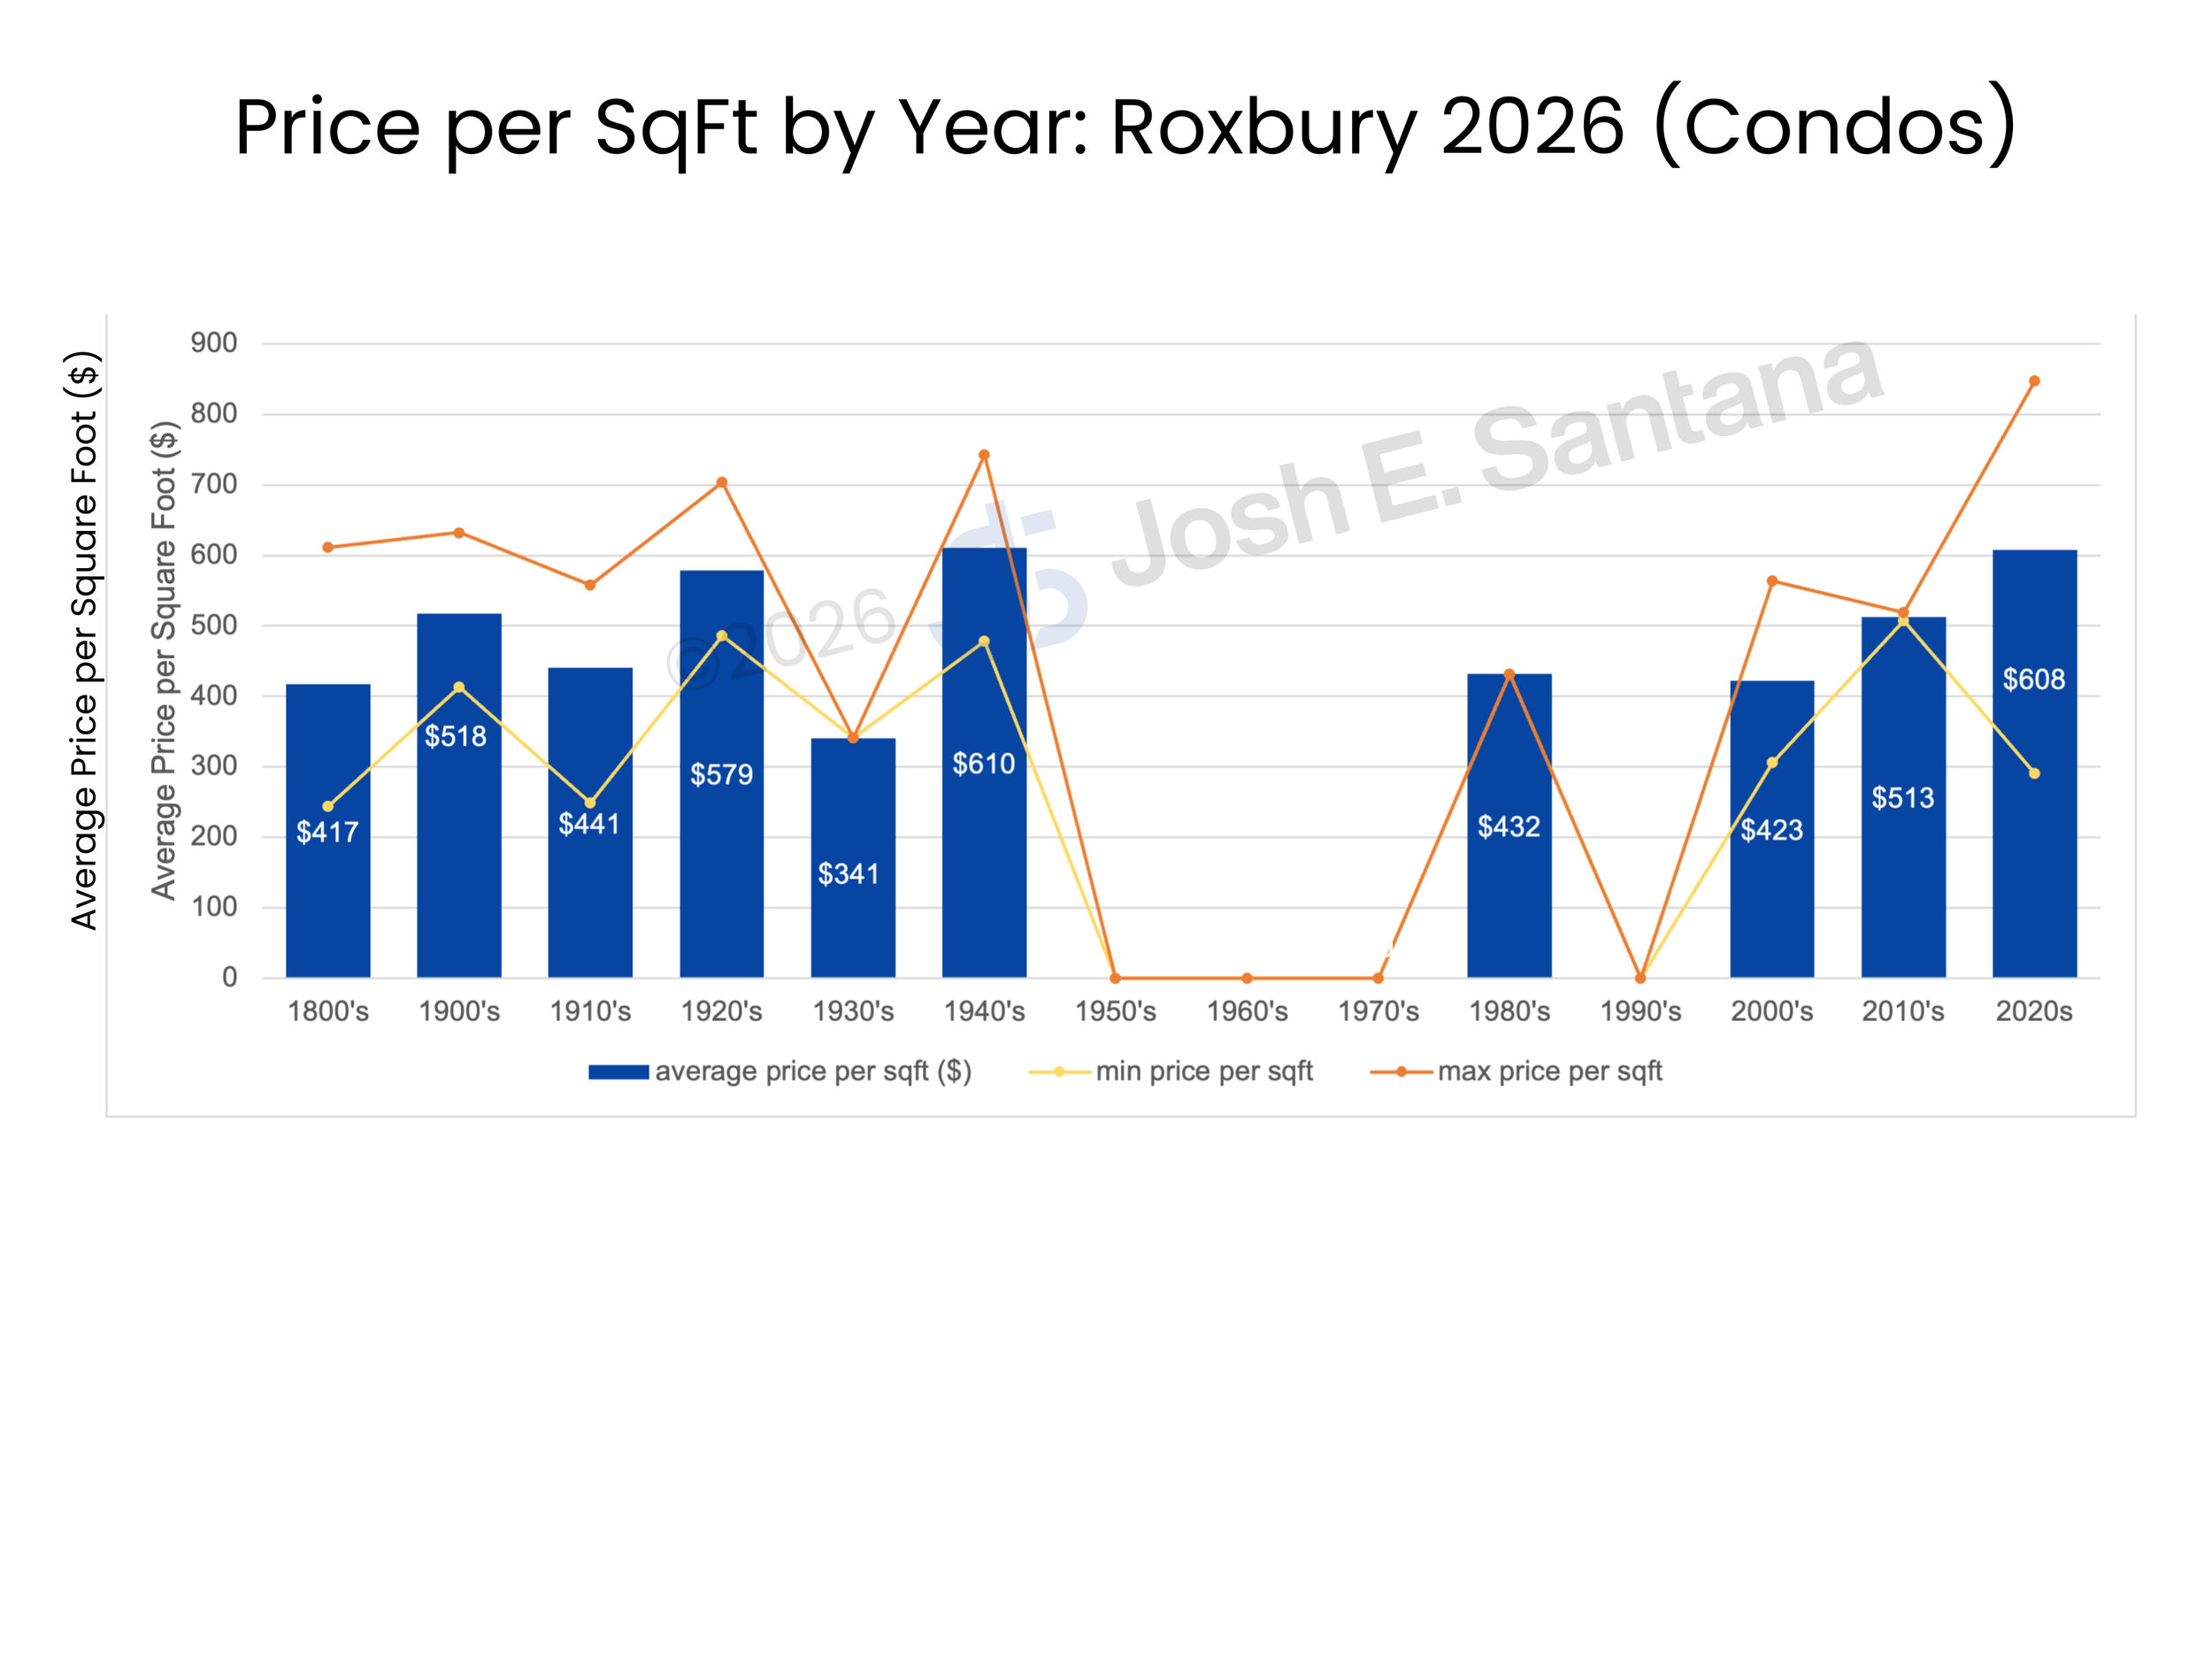
This graph shows the average, maximum, and minimum price per square foot based on the year built of a home. Homes built in the 1930s have the lowest average price per square foot and homes built in the 1940s and 2020s have the highest price per SqFt. Because homes built in the 1940s & 2020s have one of the higher price per square foot, this could indicate that there is desirability for this era of home in Roxbury. Many of the homes in the 2020s are new construction which buyers seem to be preferring in Roxbury.
➡️…By Living Area
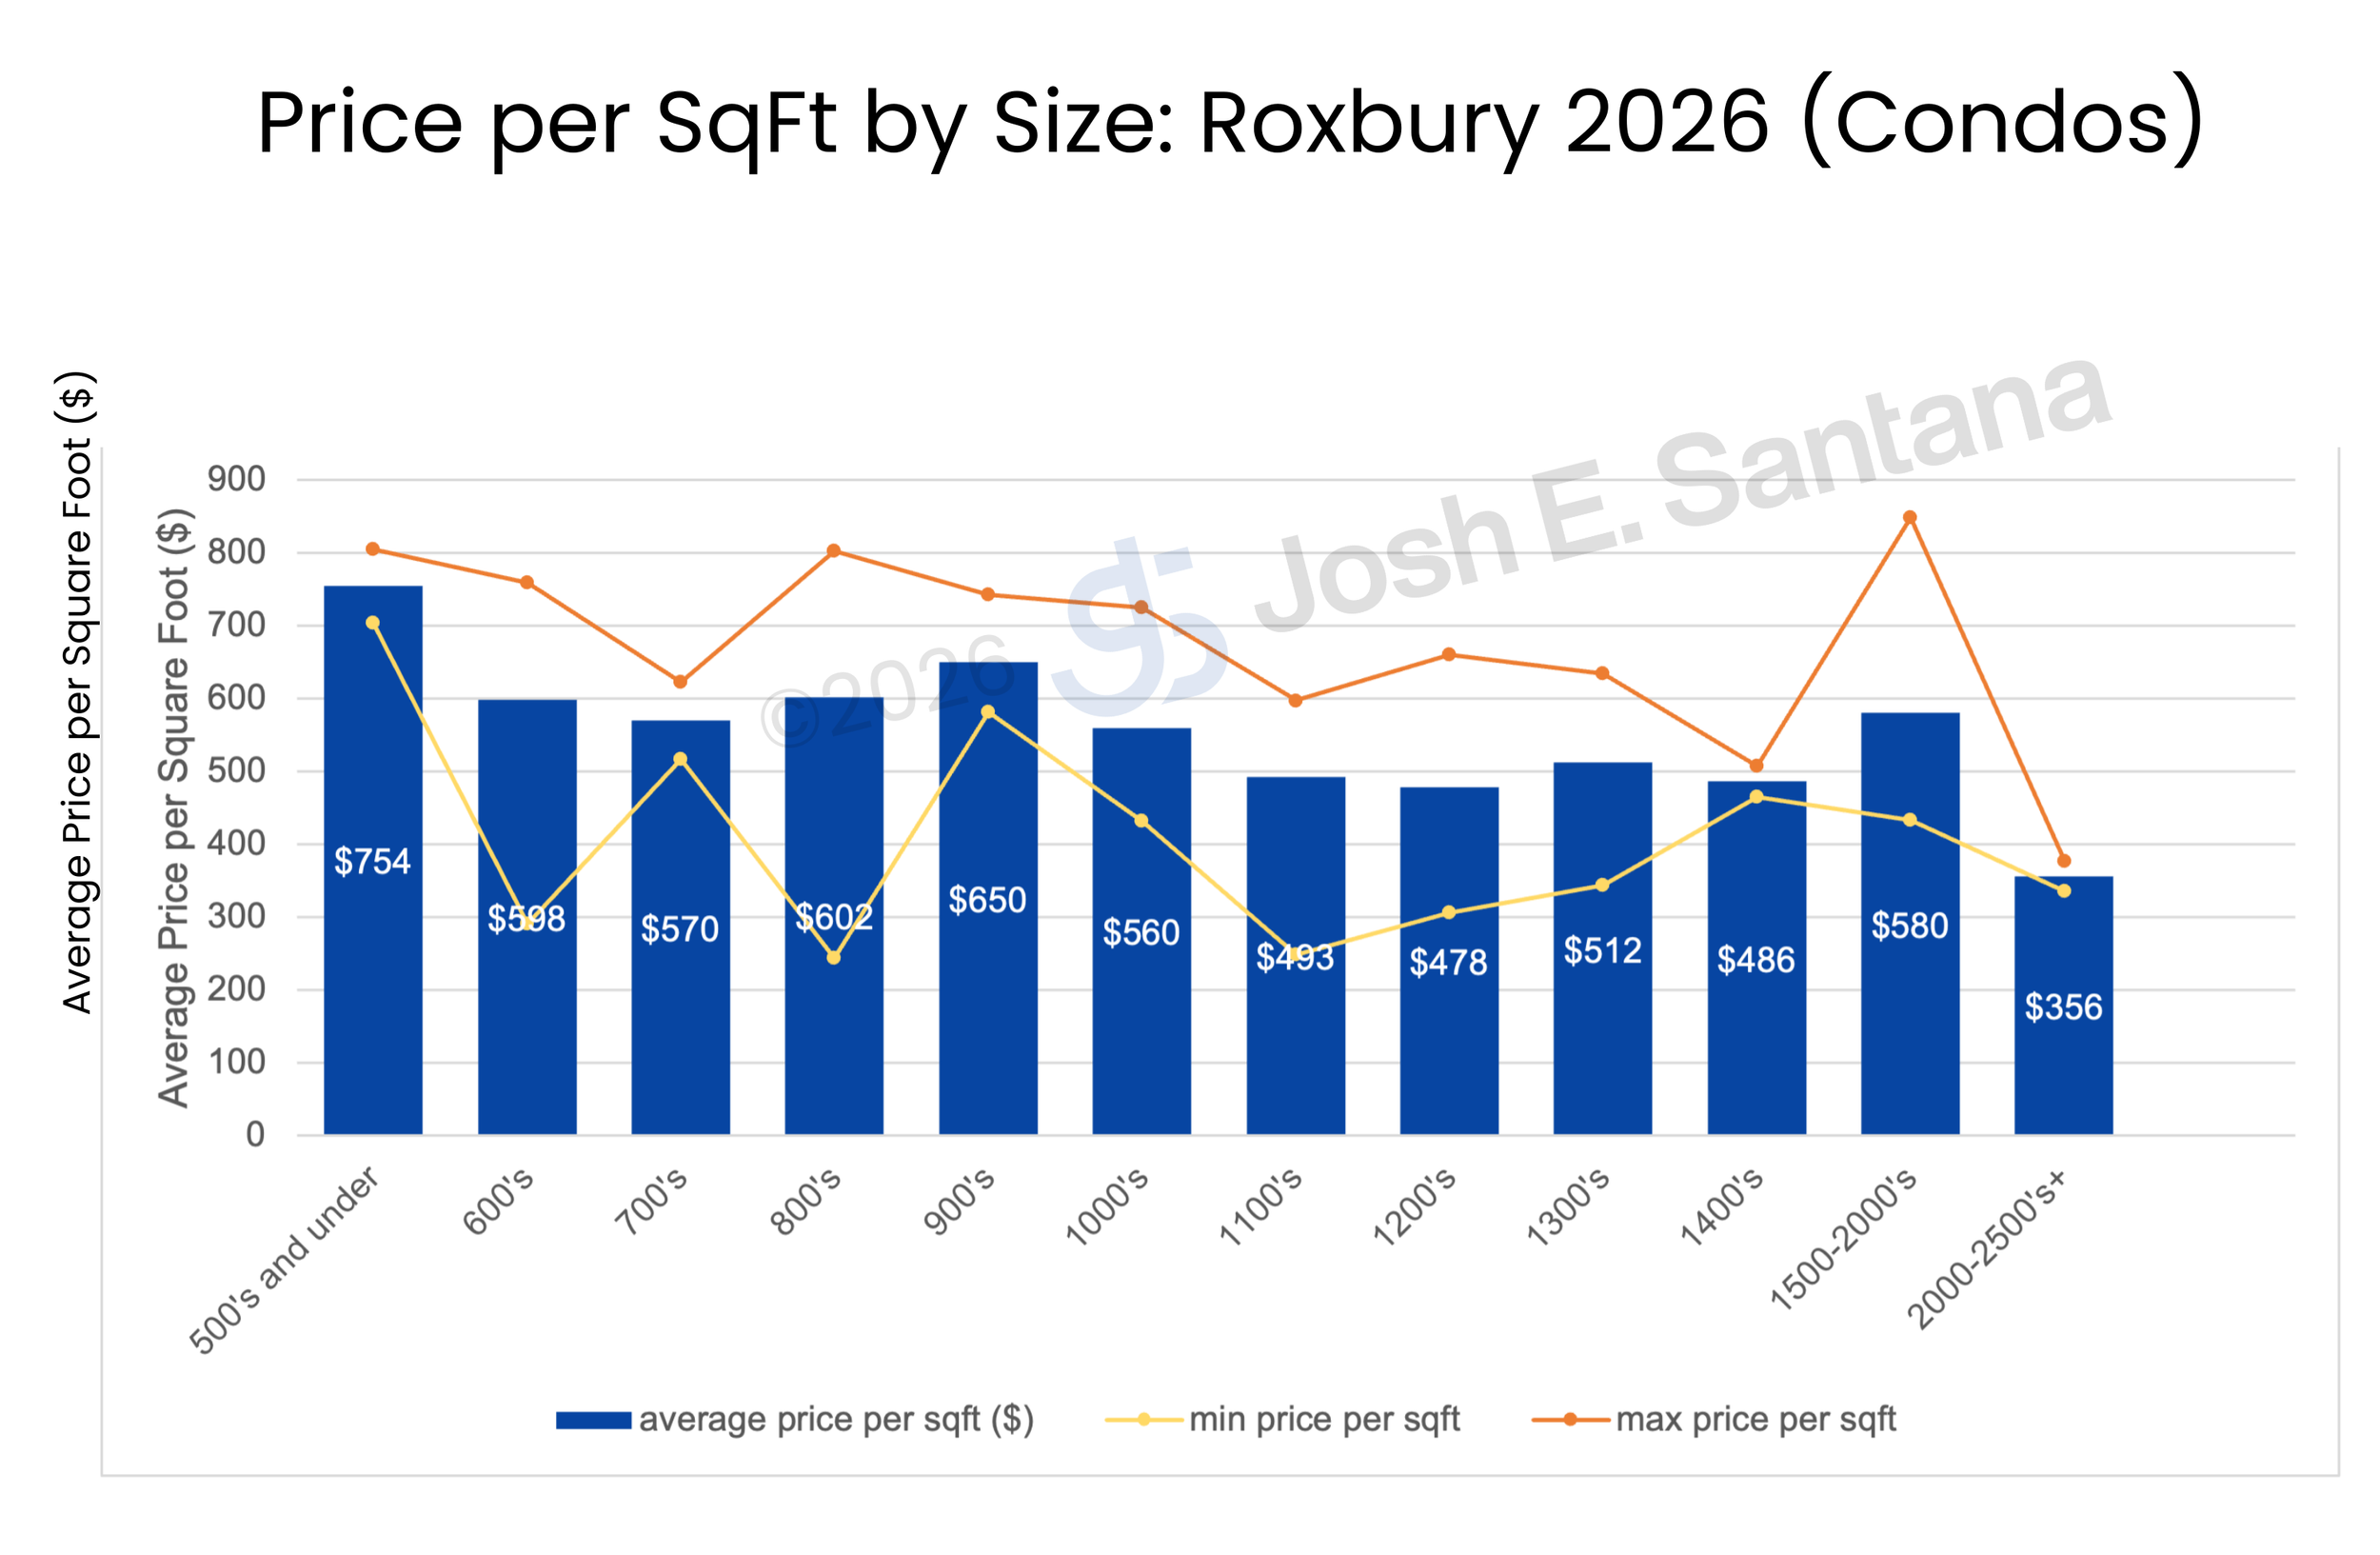
This chart shoes the price per SqFt for condos in Roxbury given the total living area of the home. It is common across towns to see an increase in the price per square foot for smaller sized homes, as it reflects the minimum cost of a home in a town irrespective of the property size.
As the properties get bigger, the price per SqFt usually goes down. We see a downward trend starting with homes in the 1000’s SqFt and higher. However, we do see a bump back up for demand in homes sized 1500-2000 SqFt before going back down significantly.
Absorption Rates
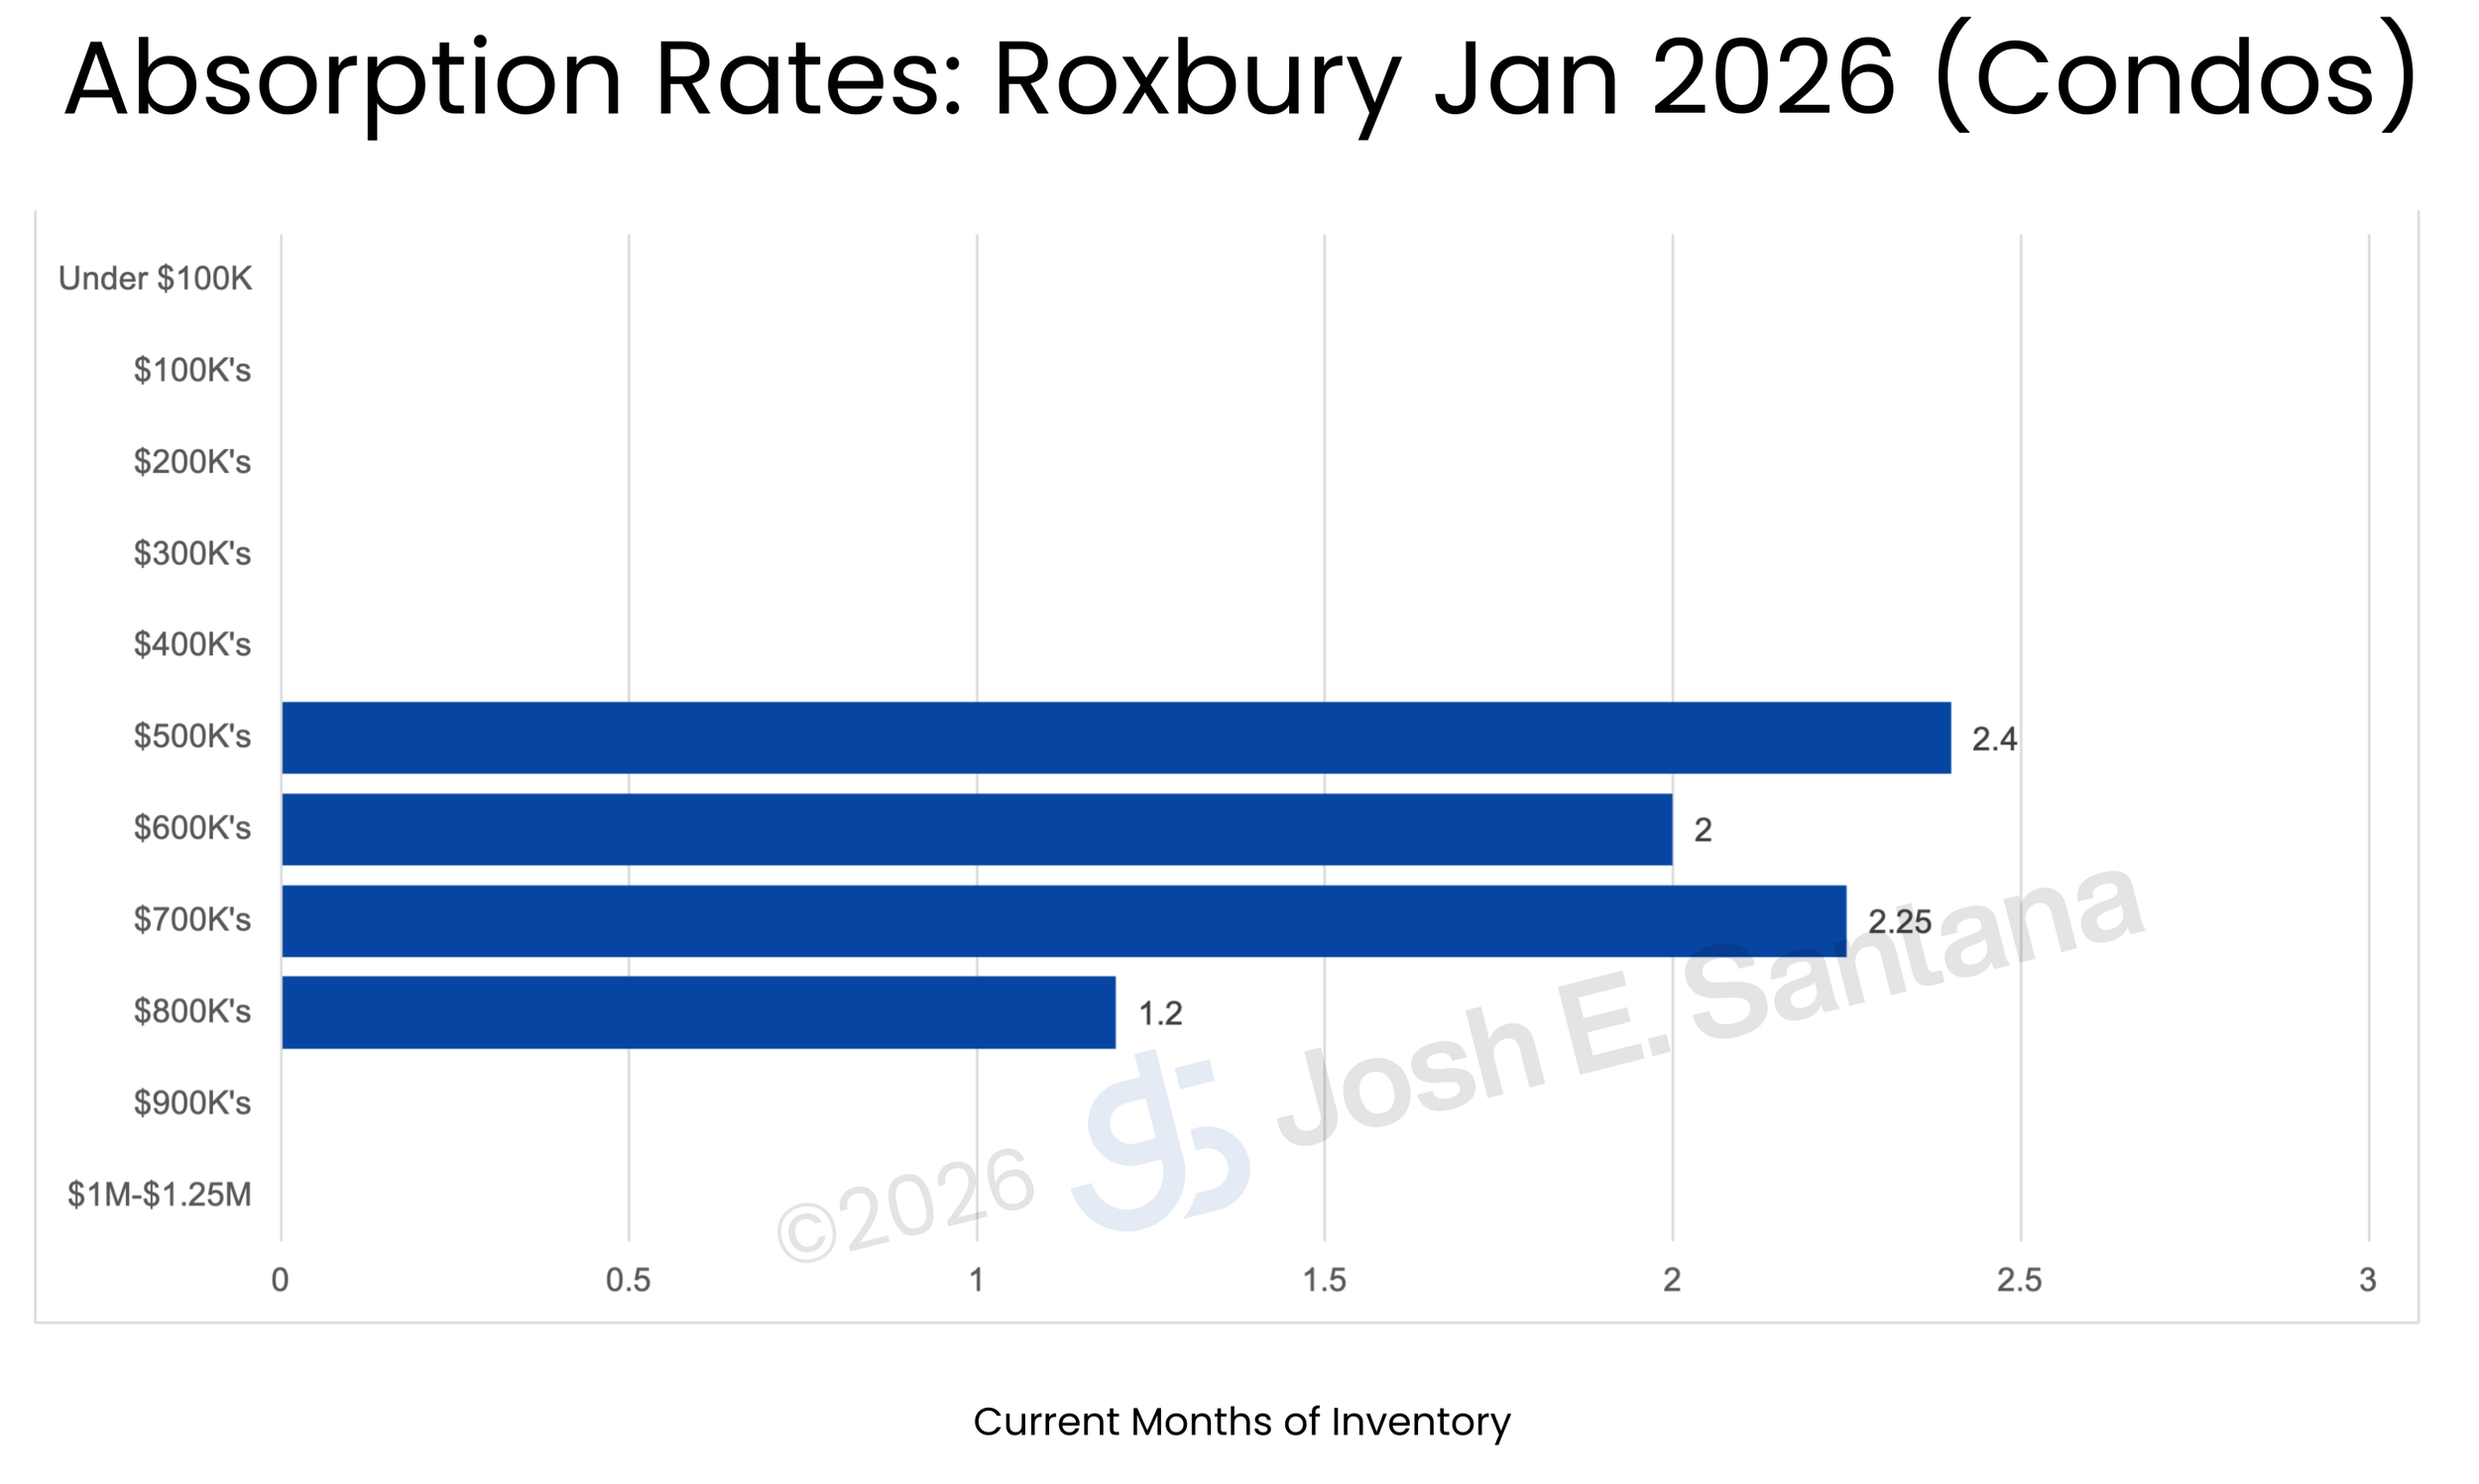
This chart shows how many months’ supply of inventory there is in each given price range. It uses the rate of sales over the last 12 months, and the number of current homes available for sale, to calculate the number of months that it would take to sell the available inventory. This is referred to “Absorption” in the real estate world.
Any price range where there is more than 7 months’ supply, we consider there to be an oversupply of inventory, also known as a ‘buyer’s market’.
Anything between 4 – 6 months is considered a balanced market.
Anything less than 3 months’ supply is considered a shortage of inventory on the market at this price range, also known as a ‘sellers’ market’.
For homes in the $500ks we see that it would take almost 2 and 1/2 months to sell the inventory that is currently available on the market.
All of these price ranges are in the ‘sellers’ market’ range.
2. Market Analysis
3. Pricing Strategy
After thoroughly analyzing relevant homes in the area, I've determined that your home's final market value falls within the range of $505,000 to $535,000.
Pricing strategy suggestion:
The list price of a home is not the value of the home, it’s an invitation.
Aspirational pricing
This is where the list price is aimed higher than the value of the home in an effort to encourage negotiations downward. This works for unique or high-end homes so might not be the best strategy for you.Perceived Value Pricing
This is where the home is brought on the market at what the general perceived value of the home might be. This might generate a couple fair offers and encourages decent buyer activity.Event Pricing
This is where the home is brought on the market at a price that is under the potential value of the home. This creates an auction like environment that bids the price of the home up. This is the strategy that my clients have the most success with.
Finding what works best for you:
Pricing is about positioning and the list price is just an invitation.
If we list the home for $34M and it’s worth $2M then we’re going to get fewer people interested.
If we listed for $1.00 then we’re going to get a LOT of action.
Our job is to calibrate this to get the best possible results and get you the highest price possible in the least amount of time.
I do have to stress that these are recommendations. We would bring your home on the market at whatever price you deem to be appropriate.
Conclusion
Unlike other agents, I do not believe in projecting more money than I think your home will sell for just to get your business...
By pricing your home competitively and leveraging effective marketing strategies, we aim to attract a high volume of interested buyers. This increased demand will naturally drive up competition and ultimately result in a higher sale price for your home.
While the decision on pricing is ultimately yours, I strongly advocate for my suggestions above. By using them, I’m confident we can achieve success in the market and secure the best outcome for you.
It’s these very strategies and recommendations that have allowed us to maintain an average Sale Price to List Price Ratio that stands at an impressive 105%. For a home in the $500K’s, that can be as much as $25,000 over ask. This is money that we make for our sellers and put directly in their pockets.